Next: Degrees of Freedom
Up: How to ask questions
Previous: What a 95% Confidence
Index
Click for printer friendely version of this HowTo
In publications, you will often times see p-values reported
as the result of some statistical test. A p-value is the
probability of an event (or series of events) taking place that would
create a statistic with a more extreme value3.1than the one you derived, assuming your model under the null hypothesis is correct.
Regardless of the type of model you are assuming describes the source
of the data under the null hypothesis, you can create what are called one-sided tests. With these
tests, there are two typical hypotheses that people make about the
mean of the underlying model. One type
of hypothesis is that the mean is less than some
value. For example, you might propose that the mean is less than
zero, or H
 . Alternatively, the hypothesis might be
that the mean is greater than zero, or H
. Alternatively, the hypothesis might be
that the mean is greater than zero, or H
 .
.
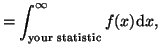
For the first type of one-sided hypothesis, the
p-value is defined as:
where  is the probability distribution you are assuming the data
came from, and
your statistic is some value derived from a function of the
data (for example, the mean of the data). This is illustrated in
Figure 3.5.1. Since our hypothesis is
is the probability distribution you are assuming the data
came from, and
your statistic is some value derived from a function of the
data (for example, the mean of the data). This is illustrated in
Figure 3.5.1. Since our hypothesis is
 , the
larger the mean of the
data is (and thus, the smaller the p-value), the more likely we will
reject the proposed model.
, the
larger the mean of the
data is (and thus, the smaller the p-value), the more likely we will
reject the proposed model.
Figure:
The p-value for a one-sided statistic where we are testing H
.
![\includegraphics[width=3in]{p_val1}](img509.png) |
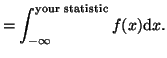
The second type of one-sided hypothesis, where we are testing to see
if the mean is greater than some value, is very similar. The only
difference is that we
integrate in the other direction. That is:
This is illustrated in Figure 3.5.2.
Figure:
The p-value for a one-sided statistic where we are testing H
.
![\includegraphics[width=3in]{p_val2}](img512.png) |
If the type of model you are assuming describes the source
of the data is symmetric (like the distributions in Figures
3.5.1 and 3.5.2) you can create what are called
two-sided tests. In this case your typical null hypothesis is that that
the mean is equal to a certain value. For example, you might propose
the hypothesis
 . Thus, if the mean of your data
is much larger or much smaller than zero, then you have
good reason to reject
. Thus, if the mean of your data
is much larger or much smaller than zero, then you have
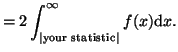
good reason to reject  . In this case, the p-value is
defined as:
. In this case, the p-value is
defined as:
This is illustrated in Figure 3.5.3.
Figure:
The p-value for a two-sided statistic where we are testing H
 .
.
![\includegraphics[width=3in]{p_val3}](img518.png) |
Obviously, the smaller the p-value, the less likely an event as rare
or rarer will take place. Often times the model proposed by the null
hypothesis, H , is rejected if the
p-value is less than
, is rejected if the
p-value is less than  . That is to say, it is assumed that the
proposed model does not explain the data if the p-value is less than .
. That is to say, it is assumed that the
proposed model does not explain the data if the p-value is less than .
Next: Degrees of Freedom
Up: How to ask questions
Previous: What a 95% Confidence
Index
Click for printer friendely version of this HowTo
Frank Starmer
2004-05-19