It all started when I arrived in Pushchino, after a weekend in Moscow. The problem was that I was having a very difficult time understanding the derivation of liminal length - a la Rushton's 1936 paper, Noble's two papers and Fozzard's paper. I was feeling that the concept was not very precise - and depended on the nature of the excitation.
Why is this an interesting question? Many cardiac arrhythmias are triggered by premature excitations that lead to a wave break and spiral wave reentry. In a physiologic sense, these premature excitations trigger reentrant tachycardias. Since a wave break reflects the failure of a wave to maintain propagation in some direction, then there must be a transition from an initial excitation at one moment to wave collapse at the next moment and this might be possible when conditions for excitation are marginal - hence my interest in near-threshold excitation, the liminal region concept and the mechanism of front formation. In a general sense, behavior at the bifurcation may reflect the boundary between health and disease whereas behavior far from a bifurcation probably reflects more "pure" health or more "pure" disease.
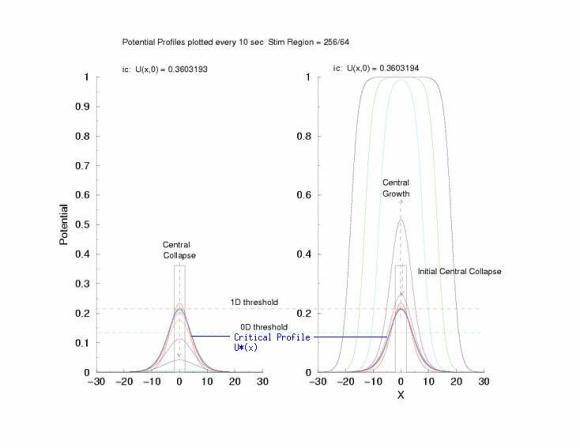
There is really not much that I am aware of about the initial moments of forming a wave following a disturbance (or excitation) in cardiac or BZ or FHN media. Typically we assume that it "just happens" - i.e. we stimulate and the wave either fails to propagate or propagates. But a closer look at the membrane potential during the front formation process and the moments after the end of a stimulation shows quite interesting behavior. Below are the early thoughts about the dynamics of front formation and particularly, the transition from stimulus to a critical front structure, we call U*(x), to either a collapsing wave or a propagating wave. One of the main observations I made from these numerics was that no matter what the form of the initial condition, the resulting front collapses to a standard configuration (in 1 D, a sinh^2(x) ) which Tassos Bountis and I showed was the separatrix between expanding and collapsing fronts.
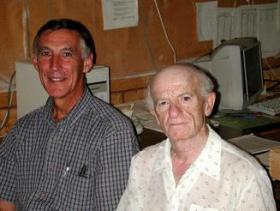
Our Team: Frank, Emmanuil, Sasha, Oleg, and Vadim. Guess who runs every day at noon?



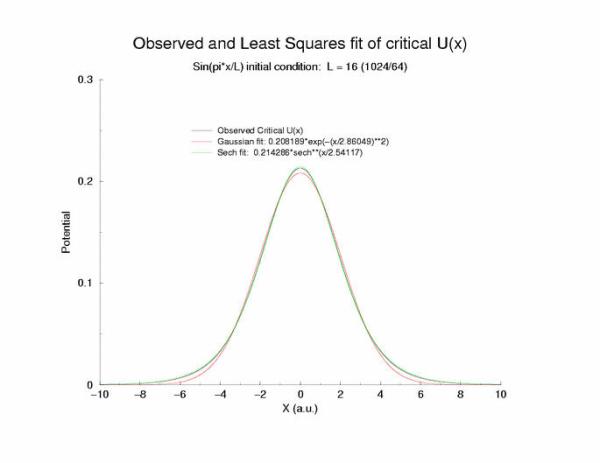
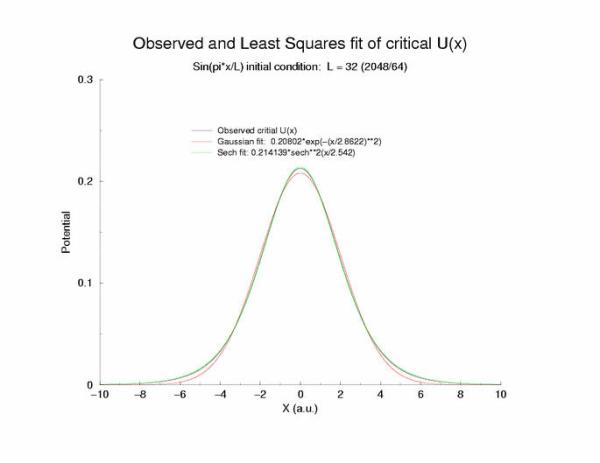
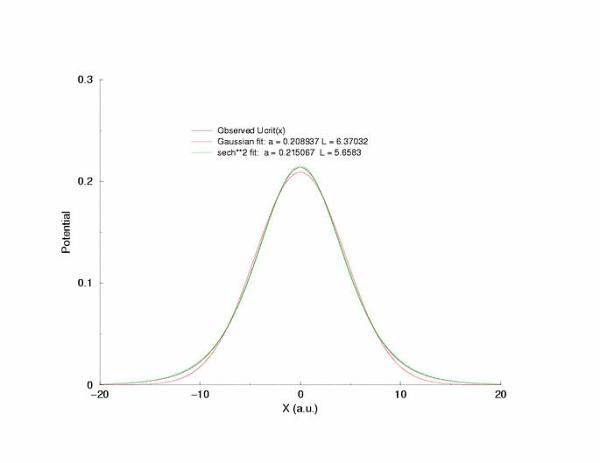
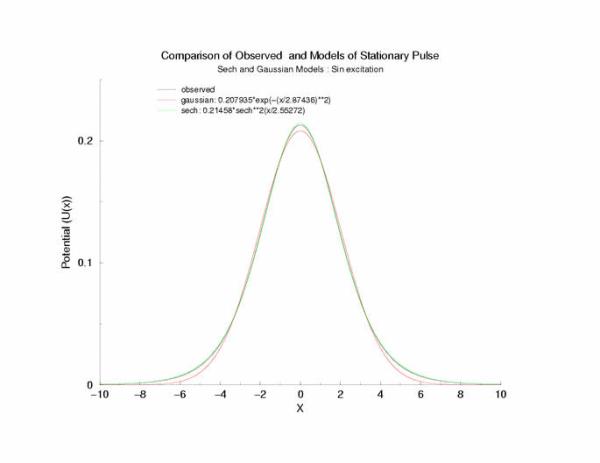
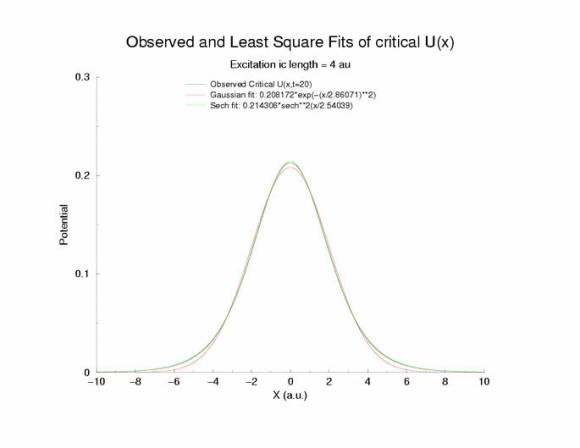
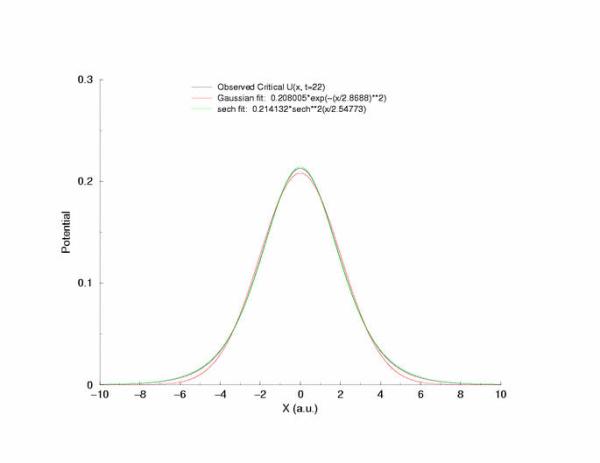
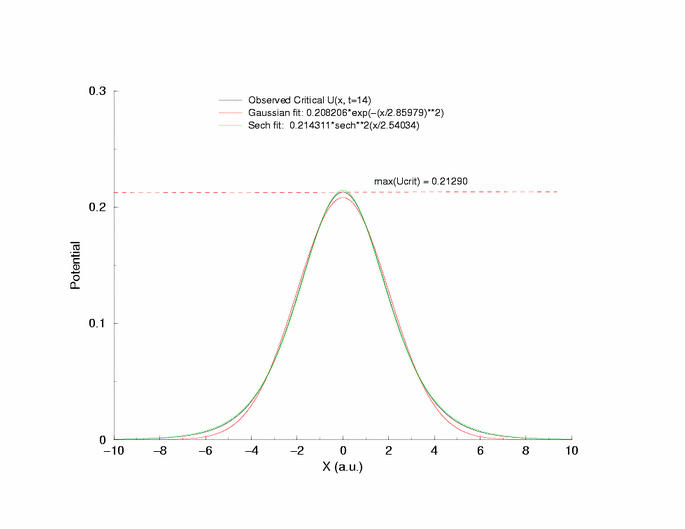
Probably everyone in Pushchino thought I was a bit goofy with my struggle. Prof. Shnol visited the lab for water - and word trickled to me that he was around. I had met him once before and knew that he was a talented mathematician. When I approached him - he was pessimistic so since I knew my problem was a serious problem, I realized that I had made a poor presentation of my problem. Oleg Mornev, also, initially thought all was ok and that I was out in la-la land. Sasha Medvinsky, simply smiled, with his usual optimism. So I started to make some graphs - realizing that my articulation of my struggle was ineffective!!! The focus of the study is to understand the dynamics of front formation or front collapse under conditions of near-threshold excitation. What I am interested in is "what is/are the physical principle(s) that drive the early post-excitation spatial evolution of the membrane potentials toward the zero-velocity distribution"? Empirically, the spatial distribution of this zero-velocity critical potential distributuion is not gaussian, but is well fit by a*(1-tanh**2(x/L)) or a*sech**2(x/L). (back substitution as a solution doesn't work for me - possibly an algebra mistake?).
Below are the graphs which I hope will help others help me improve the precision of my problem statement and identify the underlying physical principles and perhaps interesting generic properties that link membrane properties with the shape of the critical potential profile. A second interesting observation is the existance of two thresholds - a zero dimensional threshold for excitation that is determined by the middle root of the cubic function and then a 1 dimensional threshold - this critical U*(x) zero velocity profile.
We start with a simple FitzHugh cell described by
Ut = gNa*f(U) + Istim where f(U) = U(1-U)(U-a) and gNa is a constant that mimics Na conductance in physiologic models;
a = 0.139 and Istim is a pulse (1 unit duration) of current to the specified amplitude.
(Note that there is no inhibition term.) Thus the behavior simply reflects the 3 zeros of f(U) - U = 0 and 1 and stable, and U = a is unstable. The main idea is that as one reduces Istim to the neighborhood of the unstable equilibrium there is a delay in the transition from U=0 to U=1.
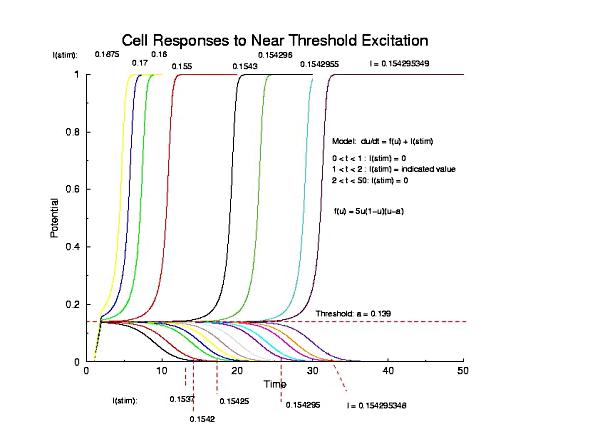
Figure 1 - the potential, U, of a single cell (no diffusion) following near threshold excitation using an externally applied pulse of current
Cable Responses: Initial Condition Excitation (rectangular pulse: gNa = 1, never delete mistakes. Initially I studied the evolution of stimuli using gNa = 5. Then I forgot and made some studies with gNa = 1. Noting there was an inconsistency between the spatial profile of the critical U(x), I "discovered" that I had overlooked (a polite way of saying I made a mistake) the value of gNa. I've now recomputed results using gNa = 5. Rather than deleting the gNa = 1 results - I've included them - as they may give some insight into the role of diffusion and the threshold of excitation in defining Ucrit(x)
Now here, we add the diffusion term which has trigger waves as solutions:
Ut = gNa*f(U) + Uxx + Istim(x).
where gNa is a multiplier to mimic physiologic parameters - in this case, we use 1 (a mistake) and 5.
where the excitation length is 256/64 = 4 units (for the initial condition studies) and 2048/64 = 32 units (for the rectangular pulse stimulation).
We consider two situations: excitation via an initial condition
(where Istim(x,t) = 0 ) (figures 2 and 3)
and excitation via a pulse of injected current where Istim(x,t) != 0 for
some interval of time (figures 5 and 6.
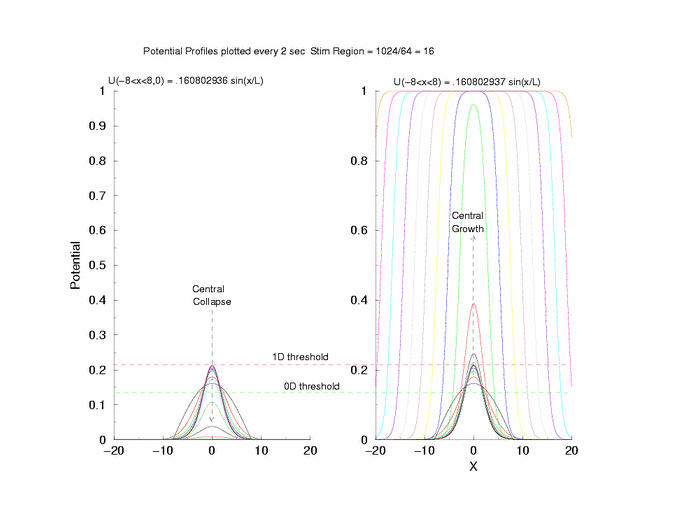
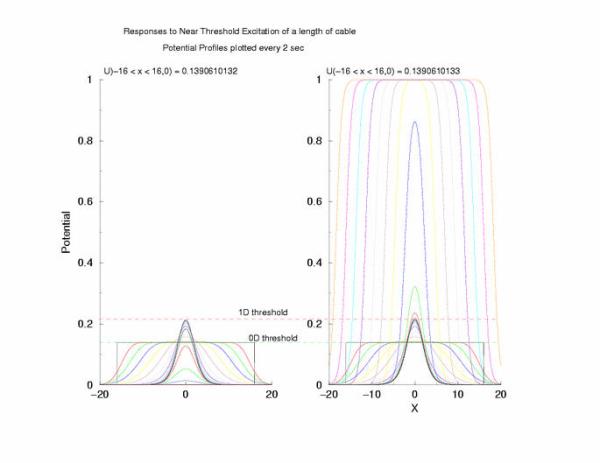
The main observation from the below graphs is that there
appear to be two regions during the evolution of a front where
the potential distribution tends to linger - suggesting
two distinct threshold-like phenomena. Not only is
there there the threshold for excitability, at U = a, but there is
is a suggestion of a second threshold:
that for establishing a stably propagating front.
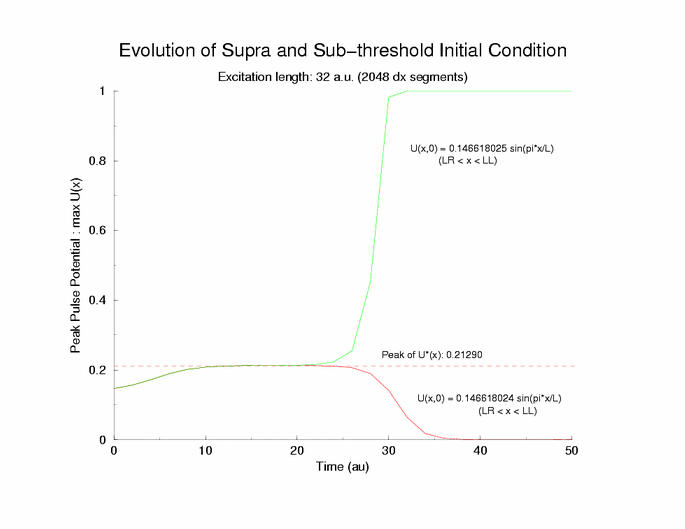
The threshold of excitability
is governed by the middle zero of f(U) while we speculate
that the threshold of propagation
is related to the solution of Uxx + f(U) = 0, i.e. the profile of a zero
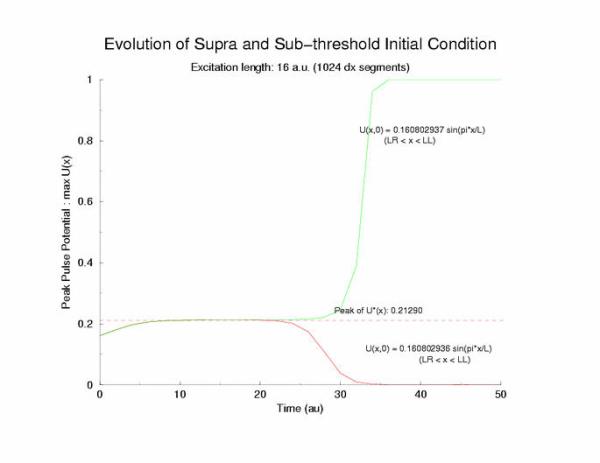
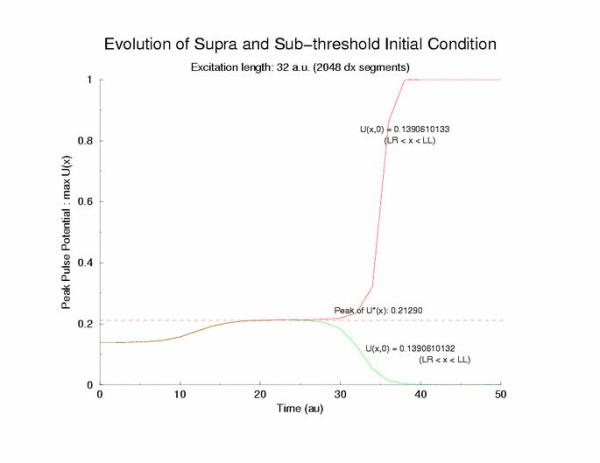
velocity pulse. The peak of this profile, max(U(x)) = 0.21290, a
root of the integral of f(U). Here are the responses to a step function in
initial condition: 0 < x < LL, U(x,0) = 0; LL <= x <= LR, U(x,0) = V;
LR < x < end of cable, U(x,0) = 0.
Here are plotted the potential profiles every
10 time units - starting with the ic (black).
I forgot the multiplier in front of f(u) for the
initial condition experiments. Above and in the external stimulation
studies (figs 5-8), the fast function is 5u(1-u)(u-a). Here the fast
function is u(1-u)(u-a). The confusion arises from trying to mimic
cardiac Na channel behavior where gNa is the macroscopic conductance. The
FHN analogy is gNa * u(1-u)(u-a) - and I simply forgot to set gNa = 5.
The practical difference is that the critial pulse width of U*(x) is
roughly half (about 2.6 when gNa = 5) of that when gNa = 1 (about 6)
gNa = 1, Excitation Length = 4 Rectangular Initial Condition
Figure 2: Temporal evolution of the potential profile in a
cable of excitable cells (diffusive coupling) following a
step function in the initial condition. The black rectangular pulse is
the profile of the initial condition, U(x,0).
Note that in this figure,
there is a region where the peak of each profile is about 0.2.
The close
spacing between the profiles indicates a slow propagation velocity - and Oleg
suggested that I plot the peaks. What a great idea!!! Below is the temporal
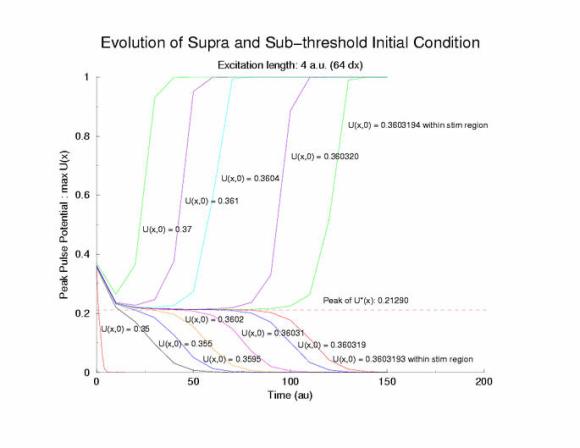
evolution of the peak of each profile, max(U(x, t=0,10,20,30,40,... )) and
you can see that peaks visit the critical point, 0.21290 (see above note)
and the residence time is longer as the ic value approaches a critical value.
Figure 3: The temporal evolution of the peak of the potential
profiles following a step function in the initial condition.
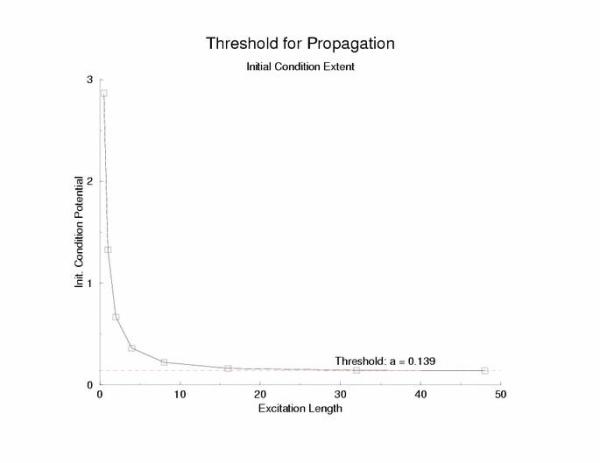
Below is the stimulus-length relationship. This reflects the threshold
initial condition as a function of the excited region is bounded by
x = LL on the left and x = LR on the right such that for the initial
condition, U(x < LL,0) = 0; U(x > LR,0) = 0; U(LL <= x <= LR,0) = U(ic)
Figure 4: Threshold initial condition potential as a function of
the excited region
gNa = 5.0; Excitation Length = 4 (256 dx segments) Rectangular
Initial Condition
gNa = 5.0; Excitation Length = 32 (2048 dx segments) Rectangular
Initial Condition
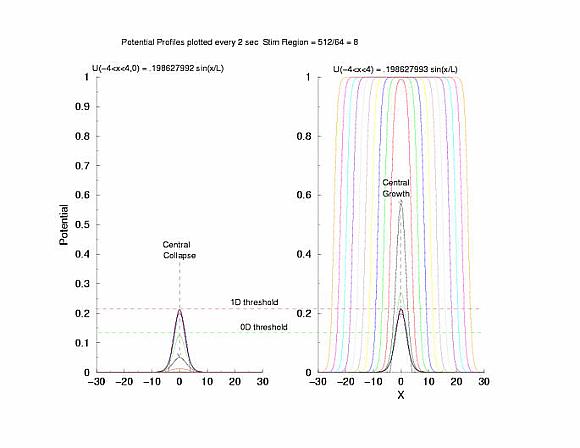
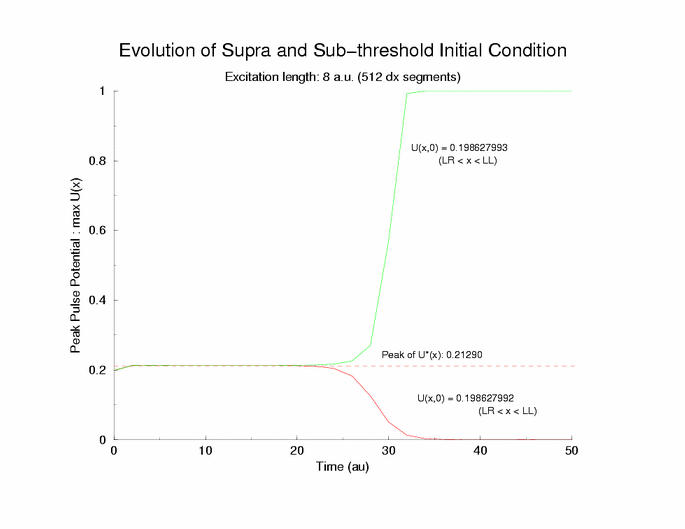
gNa = 5.0 Exciation Length = 8 (512 dx units) Sinusoidal
Initial Condition
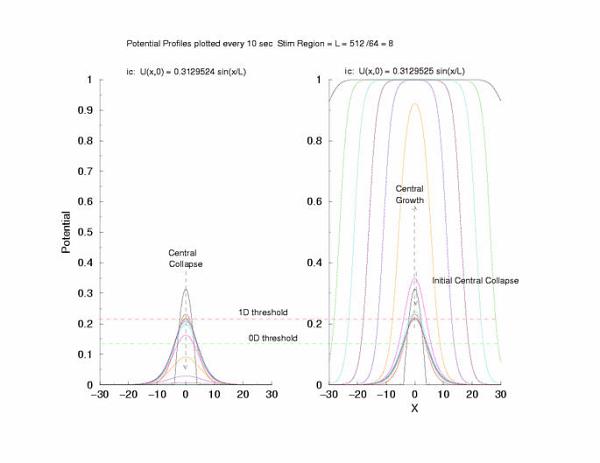
Collapse and Expansion from an initial sinusoidal initial condition
Temporal evolution of max(U(x))
Fit of the observed critical U*(x) to sech**2 and gaussian functions
gNa = 5.0 Exciation Length = 16 (1024 dx units) Sinusoidal
Initial Condition
Collapse and Expansion from an initial sinusoidal initial condition
Temporal evolution of max(U(x))
Fit of the observed critical U*(x) to sech**2 and gaussian functions
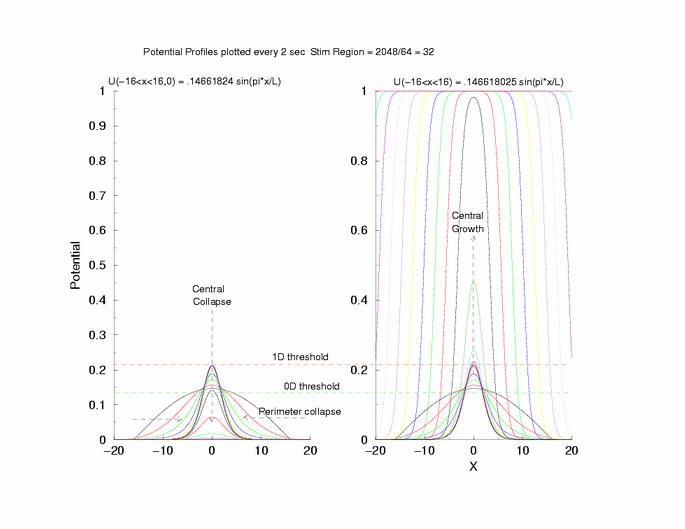
gNa = 5.0 Exciation Length = 32 (2048 dx units) Sinusoidal
Initial Condition
Collapse and Expansion from an initial sinusoidal initial condition
Temporal evolution of max(U(x))
Fit of the observed critical U*(x) to sech**2 and gaussian functions
Cable Responses: Initial Condition Excitation (sinusoidal pulse):
gNa = 1 (never delete mistakes)
Beware: the fast function for the sinusoidal
initial condition was u(1-u)(u-a) and thus, when comparing these results
with the external stimulation results (figs 5-8) where I used
5 u(1-u)(u-a) - the critial pulse widths are different - larger (roughly
2x )when the multiplier = gNa = 1 than when the multiplier = gNa = 5.
gNa = 1.0 Exciation Length = 8 (512 dx units) Sinusoidal
Initial Condition
Collapse and Expansion from an initial sinusoidal initial condition
Fit of the observed critical U*(x) to sech**2 and gaussian functions
Cable Responses: External Applied Rectangular Current Excitation,
gNa = 5
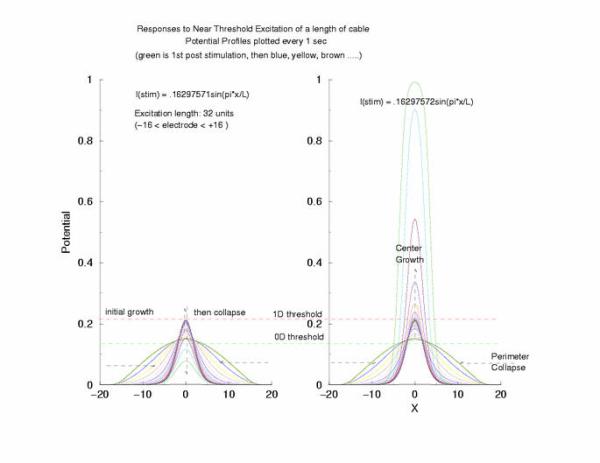
Instead of exciting with an initial condition, here we
inject current along a length of cable of length, L. After termination
of the stimulus current the potential profile collapses at the
boundaries with the unexcited regions and starts to increase in the
middle of the excited region. Here I refer
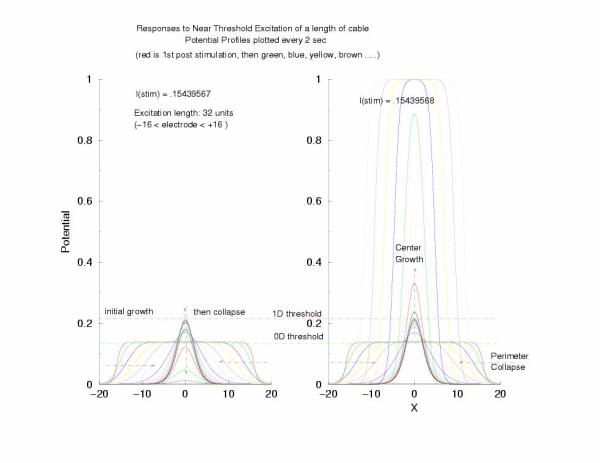
to the threshold of excitability (a = 0.139) as the 0D threshold and the
threshold for propagation (U = 0.21290) as the 1D threshold. Note the
similar slow velocity of evolution as the pulse profile approaches that of
what we speculate is the solution to Uxx + f(U) = 0.
The peak of the zero-velocity profile is determined by the value of U
such that the intergral of f(U) from 0 to Ucrit = 0. So we solve for
the roots of the polynomial:
U**4/4 - 4*(+a)U**3/3 + aU**2/2 = 0
which is equivalent to U**2 - 4U(1+a)/3 + 2a = 0
which has roots: 2(a+1)/3 + sqrt[(4a - 2)(a - 2)]/3 and
2(a+1)/3 - sqrt[(4a - 2)(a - 2)]/3
so when a, the threshold of cellular excitation is 0.139, the two roots
are 0.21290 and 1.30576. The root associated with the zero-velocity profile
is the smaller of the two, 0.21290, which we label as the 1D threshold.
From this relationship, we can see directly how
the media properties alter the zero-velocity profile. Our model assumes
a diffusion coefficient of 1.
This simple analysis (perhaps too simple) indicates that the
amplitude of the zero velocity
profile is dependent ONLY on the media excitability, while the morphology
of the zero velocity profile is influenced by both the threshold of excitation
as well as the diffusion coefficient.
gNa = 5.0 Excitation length = 32 (2048 dx segments)
Figure 5: The tenporal evolution of the potential profile
following excitation by an externally applied (Istim) current for a
duration of 1 time unit and a value near threshold. Note the collapsing region
at the periphery of the excited region and the increase in amplitude at the
center of the excited region.
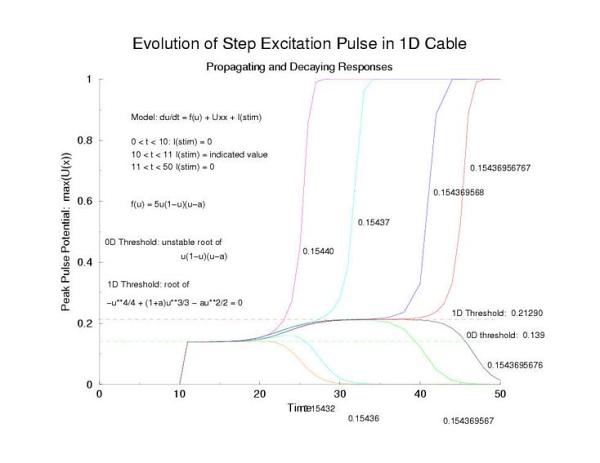
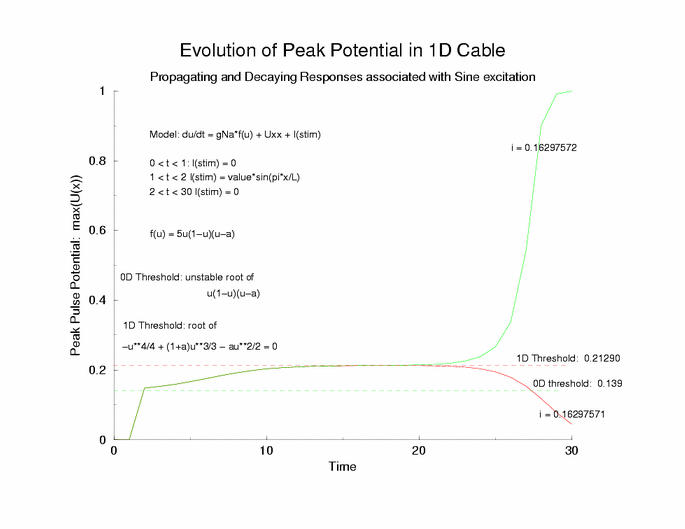
Here is the plot of the peaks of each pulse, max(U(x,t=0,10,20,30 ...))
for a range of stimulus currents. This graph clearly illustrates the
two-threshold possibility - an initial visit to the threshold of excitation
of an individual cell (a = 0.139) then a transition to the threshold for
propagation (U = 0.21290) - the peak of the zero-velocity profile, U(x).
Figure 6: The tenporal evolution of the peak of the potential
profiles - following pulse excitation (Istim). Note that the peaks appear
to pass through two thresholds, one that coincides with the threshold
of media excitability (a = 0.139, middle root of f(U)) and one
that coincides with the peak amplitude of a zero velocity profile
of a front.
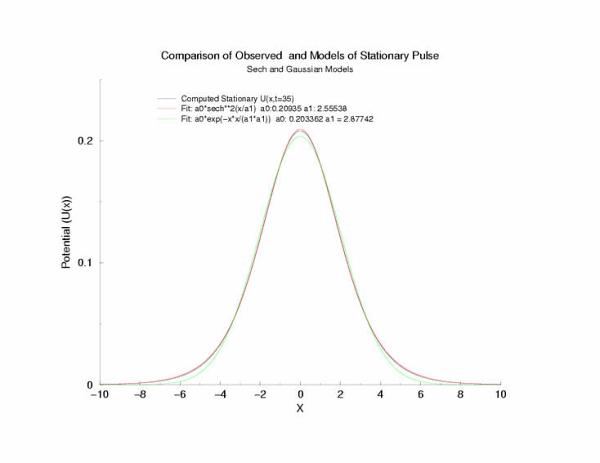
A comparison of fitting the quasi-stationary U(x) profile - a0*(1-tanh**2(x/a1)
and a0*exp(-x**2/a1**2)
Figure 7: Selecting a pulse from figure 5 that appears to be stationary
and fitting the hyperbolic and gaussian functions.
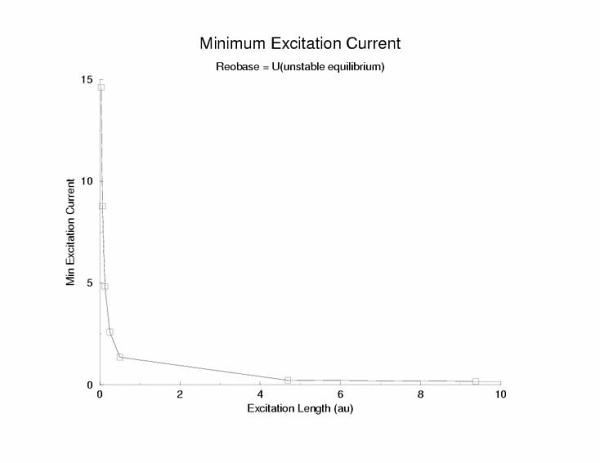
The relationship between stimulus amplitude and excitation length
Figure 8: The relationship between excitation length and
stimulation current for a trigger wave in a cable - evidence that there is
probably not a pure liminal length, but rather a region (our stationary
profile of U(x) whose width has the meaning of liminal length.
Return to Pushchino 2002 adventures
Copyright C. Frank Starmer 2002
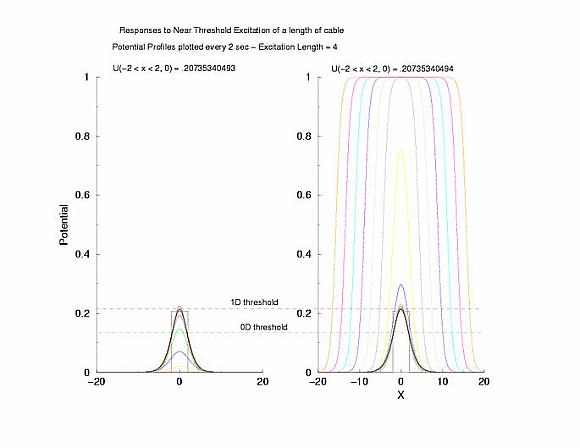
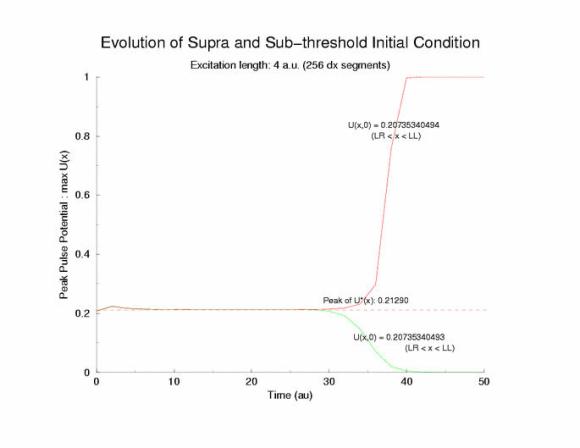
Cable Responses: Initial Condition Excitation (rectangular pulse):
gNa = 5, equivalent to fig 5-8 external stim (correction of my
error above (wrong gNa constant)
Cable Responses: Initial Condition Excitation (sinusoidal pulse):
gNa = 5 Length = 8
Cable Responses: Initial Condition Excitation (sinusoidal pulse):
gNa = 5 Length = 16
